False expectations of the market breeds a huge throng of unrealistic homeowners.
Unrealistic Homeowners: Orange County seems to be home to a flood of homeowners who refuse to listen to professionals and ignore irrefutable market fundamentals.
Just like last year, Santa should have plenty of homeowners on his “naughty” list. With all of the television, newspaper, and Internet reports exclaiming massive home price appreciation, owners have clamored to place their homes on the market to get a piece of the action. Many are electing to wait until the Spring Market thinking that it is “the best time of the year to sell.”
The trouble is that they are ignoring today’s fundamentally different housing market that requires a completely different approach than the 18-month market that ended in August. That market allowed many homeowners to get away with overpricing a home. Homes were not just a good value, incredible interest rates in the mid-three’s made home affordability seem out of this world. Almost every home acquired multiple offers and the market was dominated with cash buyers. Homes flew off the market and they sold at prices much higher than the most recent comparable sale.
Flash forward to today and homes have appreciated to levels where they no longer look like an amazing deal. Buyers do not feel the necessity to drop everything and do whatever it takes to purchase. Instead, they are demanding to pay the Fair Market Value of a home based upon the most recent comparable pending and closed sales. The expected market time is at nearly three months today compared to as low as 33 days earlier this year and 40 days a year ago. Last year the market never really took a break during the holidays. Not this year, the normal holiday slowdown has infiltrated Orange County housing. Open houses generated more than 50 potential buyers earlier in the year when there was almost nothing on the market. Today, open houses produce only a handful of buyers as the inventory has blossomed considerably and the single open house sign on a busy intersection corner has now been replaced with a gaggle of directional arrows.
The market has changed, but homeowners have not received the memo. Instead, sellers continue to come on the market at unrealistic values. These values are not at all in line with the true Fair Market Value. The prices are arrived at arbitrarily. Reports from the trenches are that many rationalize the price thinking that their home is the “best home in the neighborhood.” They stretch the price based upon new carpet, new paint, or a remodeled kitchen. Unfortunately, they have found out the hard way that the market will no longer reward irrational pricing. There was wiggle room when homes not only appeared to be a value, but throw in a 3.5% interest rate and a buyer did not need much convincing. Today, these homes languish on the market.
There are still homes that fly off the market in the lower ranges and often with multiple offers, but they are priced according to the Fair Market Value, taking into consideration the changed market fundamentals. Will a home sale above the last closed sale? Sure, the right property will secure an offer a few thousand dollars higher, but not tens of thousands of dollars higher like earlier in the year.
So, many of you are wondering about all of the recent reports of mass appreciation. Dataquick, Core Logic, Case-Shiller, and the Federal Housing Finance Agency (FHFA) have all recently released outstanding, favorable housing numbers that entice homeowners to jump into the housing fray. But, what they report is no longer occurring in the Orange County real estate trenches. Dataquick highlighted November sales. Core Logic released October price trends at the beginning of this month. Case-Shiller and the FHFA index released September pricing trends at the end of November and will release October numbers soon. The trouble with all of these indexes is that they are all reporting closed sales activity, so are a reflection of 45 to 60 days prior. October sales are a result of contracts put together in August and early September. The Orange County Housing Report tracks pending sales activity and is a reflection of what is taking place in the streets right now.
Many of these reports highlight year over year statistics. While these figures may be very interesting, they only pinpoint where values were a year ago compared to this year. Instead, everybody should be concentrating on how prices are changing from month to month. But, even these statistics can be misleading, especially reports of the median sales price. The median sales price is when all prices are stacked from lowest to highest; the median is the exact middle value. There are major flaws in the median. It is easily skewed by a change in the sales mix. When the market experiences an increase in the number of luxury home sales, the median is skewed higher; and, when there is an increase in the number of sales in the lower ranges, the median is skewed lower. It is not the most reliable statistic in tracking true price appreciation.
For homeowners waiting until the Spring to place their homes on the market, they will be greeted with increased competition. Yes, in terms of the number of pending sales, it is the hottest time of the year. There may be more buyers who wish to purchase, but it is also when more homeowners come on the market than at any other time. Many unsuccessful sellers who have opted to throw in the towel and wait until the Spring will enter the fray too. Sellers during the 2014 Spring Market will be greeted by buyers only willing to pay the Fair Market Value: OVERPRICED SELLERS BEWARE.
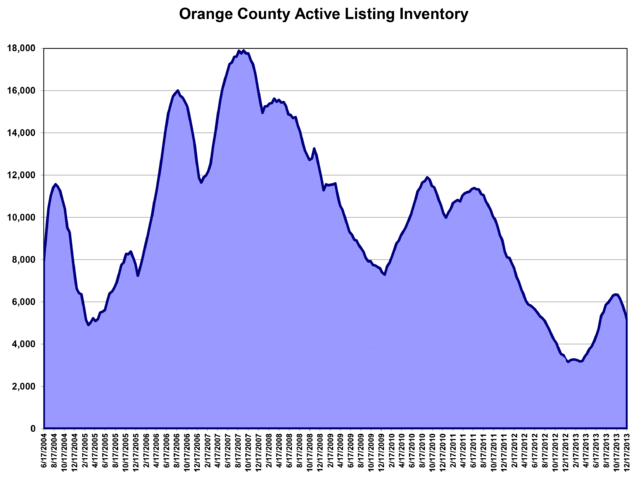
Active Inventory: The inventory shed 7% in the past two weeks as the market moves even deeper into the holidays.
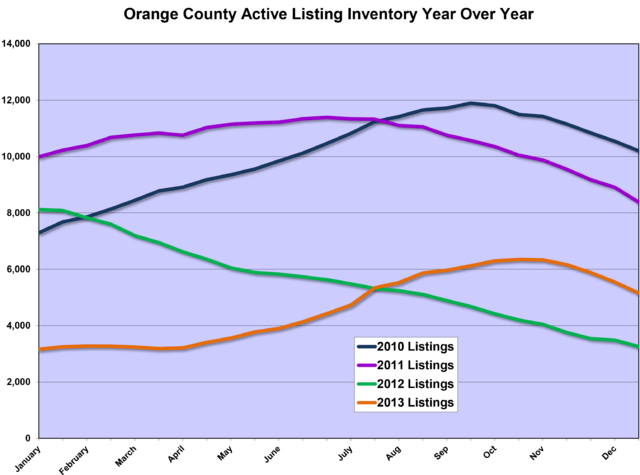
In the past two weeks, the active listing inventory shed 394 homes and now totals 5,149, dipping to levels last seen at the beginning of July. It’s the largest drop since March of last year, beating last week’s second biggest drop of the year of 337 homes. The drop will continue through the New Year celebration and will not reverse course and start increasing until mid-January.
Last year at this time there were 3,254 homes on the market, 1,895 fewer than today.
Demand: Demand dropped by 13% in the past two week and is at its lowest point of the year.
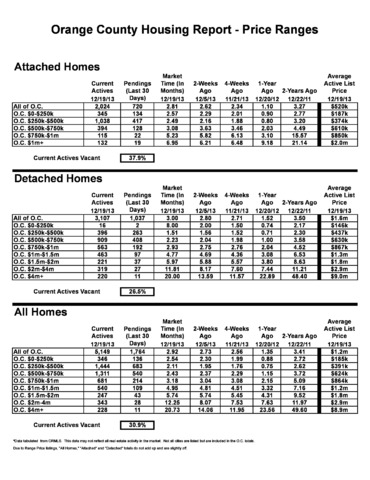
Demand, the number of new pending sales over the past month, decreased by 265 and now totals 1,764, the lowest demand reading of the year. As a matter of fact, this is the lowest reading in six years. Last year the market did not take much of a break during the holidays. Not this year. Buyers have diverted their attention away from housing and are busy attending parties and wrapping presents to be paced under the tree. Demand will reach a low in two weeks as we celebrate the arrival of 2014 and will start to climb as we roll into January.
Last year demand was at 2,413 pending sales, 649 more than today. Those numbers were a bit inflated as there were a lot more short sales embedded in demand, 649 pending short sales compared to 136 today. Since only about half of all short sales ever close, the 513 additional pending short sales skewed the demand totals last year. Even so, the disparity between last year and this year’s demand is large enough that it will result in fewer sales in the coming months in comparing year over year numbers.
Distressed Breakdown: The distressed inventory increased by only one home in the past two weeks.
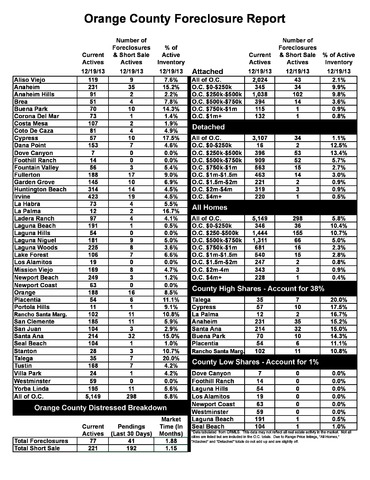
The distressed inventory, foreclosures and short sales combined, increased by one home and now totals 298. Only 6% of the active listing inventory and 11% of demand is distressed. Compare that to last year when it represented 12% of the inventory and 34% of demand, and two years ago when it represented 38% of the inventory and 59% of demand.
In the past two weeks, the foreclosure inventory decreased by 4 homes and now totals 77. 1% of the inventory is a foreclosure. The expected market time for foreclosures is 42 days. The short sale inventory decreased by 5 homes in the past two weeks and now totals 221. The expected market time has increased to 49 days. Short sales represent just 4% of the total active inventory.

:format(webp):quality(80)/u.realgeeks.media/hakolas/Facebook.jpg)
:format(webp):quality(80)/u.realgeeks.media/hakolas/GooglePlus.jpg)
:format(webp):quality(80)/u.realgeeks.media/hakolas/YouTube.jpg)
:format(webp):quality(80)/u.realgeeks.media/hakolas/Twitter.jpg)
:format(webp):quality(80)/u.realgeeks.media/hakolas/Zillow.png)