Listing inventory is dropping as more sellers opt to throw in the towel.
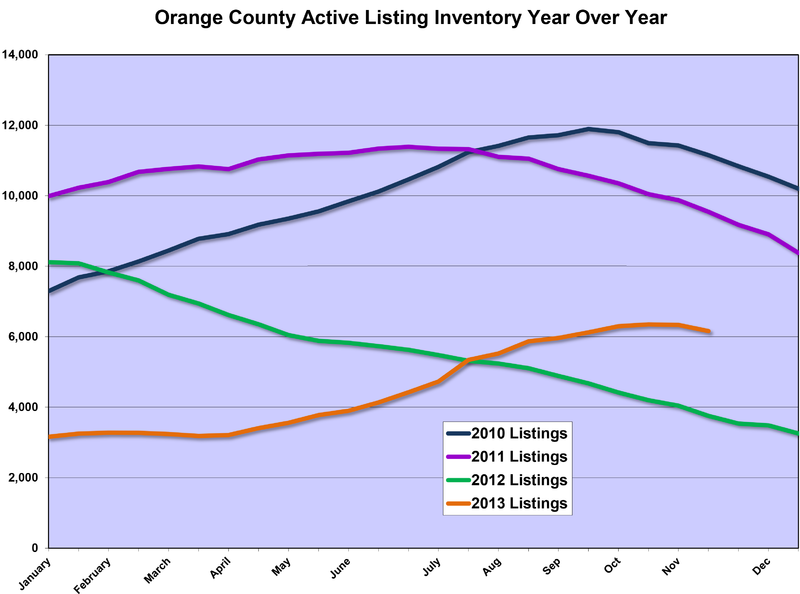
Active Inventory: Peaking in October after climbing for over seven months, the active inventory is dropping due to sellers withdrawing their homes that have sat on the market too long.
This time last year, the inventory was running on empty and demand was through the roof. It did not matter that the holidays were fast approaching; homes were procuring multiple offers and purchase prices above the list price despite the time of year. Sellers were not throwing in the towel; instead, they were contacting moving companies and boxing up their belongings after accepting a contract.
Flash forward to today, demand has dropped by 28% and the active inventory is up 64% compared to last year at this time. There are some telling signs that the market is completely different from last year. The plethora of open house signs on major cross streets on the weekends is the current trend. Homes had been selling so quickly that open houses were rare beyond the initial weekend. The steady stream of interested buyers that followed the directional arrows has been replaced by only a few buyers today. Open house activity is way down and the number of open houses on Saturday and Sunday is way up.
Another sign that the market has changed is the considerable number of price reductions. 10% of the active inventory changes the asking price each week right now. This is the time of year where sellers have to decide whether or not they have what it takes to sell, a willingness to lower the price to the true fair market value or do they want to throw in the towel. Since so much of the inventory is overpriced, if a seller really wants to sell, eventually they have come to the realization that a reduction is necessary to achieve success. The market is no longer appreciating like it had been from February 2012 through August 2013. Buyers do not want to pay more than the last guy. Instead, they want to pay the fair market value, the value based upon the most recent comparable sales. If a seller is not close to the fair market value, a price reduction is necessary.
The rise in the expected market time from 33 days back in mid-March to 81 days today is another glaring sign that the market has shifted. As inventory rises and demand drops, the expected market time increases. The inventory swelled from mid-March through mid-October and demand dropped by 39% since June. The net result, the expected market time increased in every price range. Even though sellers are looking at nearly a three month expected market time throughout Orange County, many have ignored the signs and expect the market to perform like it had earlier in the year. They have been questioning why they have not procured an offer after the first week. But, that market is in the past. Today, sellers need to be priced right or they will stagnate on the market with no offer in sight. Pricing a home right also does not mean an instantaneous offer is on its way. The best mentality is that of a fisherman. Knowing that there are fish below his boat, a fisherman casts his line recognizing that eventually he will reel in a fish, but he does not expect immediate success. Sometimes there is waiting involved.
So, where do we go from here? The active inventory will continue to drop through the very beginning of the New Year. It will rise from there. Many sellers who have decided to throw in the towel will market their homes again next year, attempting to take advantage of the best time of the year in terms of market activity, the Spring Market. However, they will be joined by many homeowners who want to cash in on the incredible rise in home values. The likely outcome will be too many homeowners coming on the market all at once and the listing inventory will rise to a much more normal level. The current inventory is actually below long term averages, around 8,000 homes.
In the past two weeks, the active listing inventory dropped by 174, or 3%, and now totals 6,159. After increasing unabated from mid-March through mid-October, the inventory dropped for the first time two weeks ago. It was only a 17 home drop, but a sign that the inventory had peaked. Today’s reading verifies that a peak had been reached. The peak should have occurred back at the end of August, but was delayed by two months on the backs of a flood of overpriced sellers hitting the market in anticipation of continued appreciation. With the arrival of holiday cups at Starbucks and other ominous signs that the Holiday Market is upon us, sellers are throwing in the towel knowing that the market is about to slow further.
Last year at this time there were 3,753 homes on the market, 2,406 fewer than today.
Demand: Demand dropped 1% in the past two week.
Demand, the number of new pending sales over the past month, dropped by 33 and now totals 2,277. Through Thanksgiving, we will continue to see small changes in demand. From Thanksgiving week through the first couple of weeks of the New Year, the Holiday Market, demand will slow to its lowest point of the year.
Last year demand was at 3,179 pending sales, 902 more than today. Those numbers were a bit inflated as there were a lot more short sales embedded in demand, 897 pending short sales compared to 224 today. Since only about half of all short sales ever close, the 673 additional pending short sales skewed the demand totals. None the less, the disparity between last year and this year’s demand is large enough that it will result in fewer sales in the coming months in comparing year over year numbers.
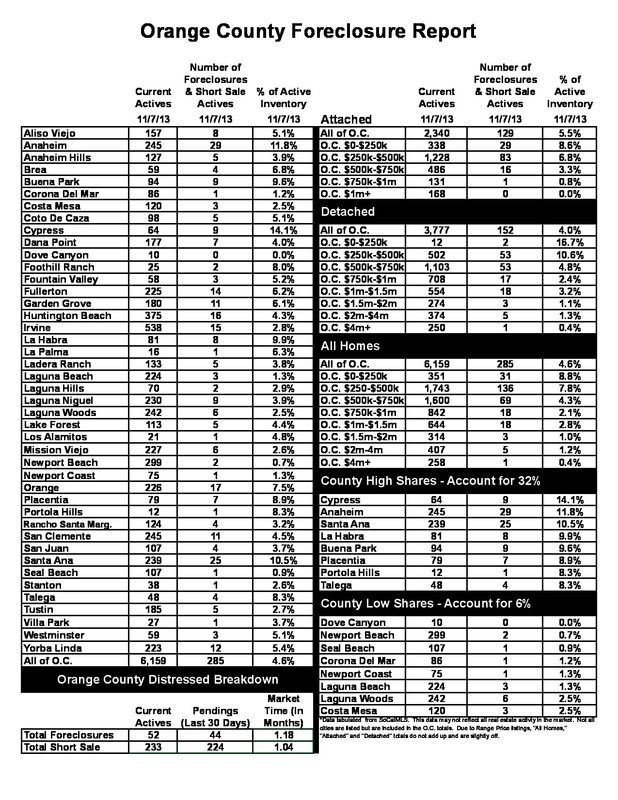
Distressed Breakdown: The distressed inventory increased by 3% in the past two weeks.
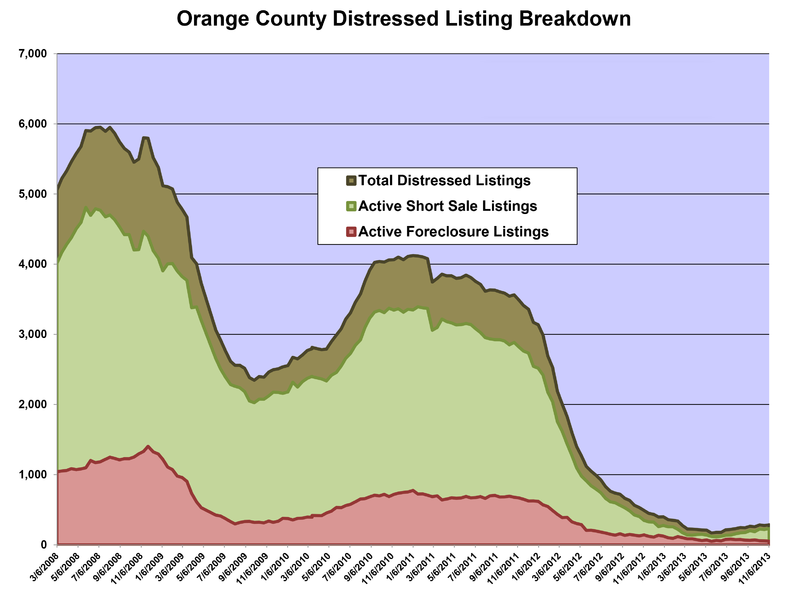
The distressed inventory, foreclosures and short sales combined, increased by 3%, or 9 homes, and now totals 285, levels not seen since February. Only 4.6% of the active listing inventory and 12% of demand is distressed. Compare that to last year when it represented 13% of the inventory and 34% of demand. Distressed properties today play only a small role in a housing market dominated by sellers with equity.
For the month of October, only 6% of all closed sales were short sales and 1% were foreclosures. The rest were good ol’ fashioned homeowners with equity in their homes. Last year, 24% of all closed sales were short sales and 7% were foreclosures. The market has changed and distressed sales have only a slight impact on today’s housing market.
In the past two weeks, the foreclosure inventory decreased by 5 homes and now totals 52. Less than 1% of the inventory is a foreclosure. The expected market time for foreclosures is 35 days. The short sale inventory increased by 14 homes in the past two weeks and now totals 233, levels not seen since January. Even with the increases, the number of short sales is still well below the significantly higher numbers from 2007 through 2012. Short sales remain the hottest segment of the Orange County housing market with an expected market time of 31 days. Short sales represent just 3.8% of the total active inventory.