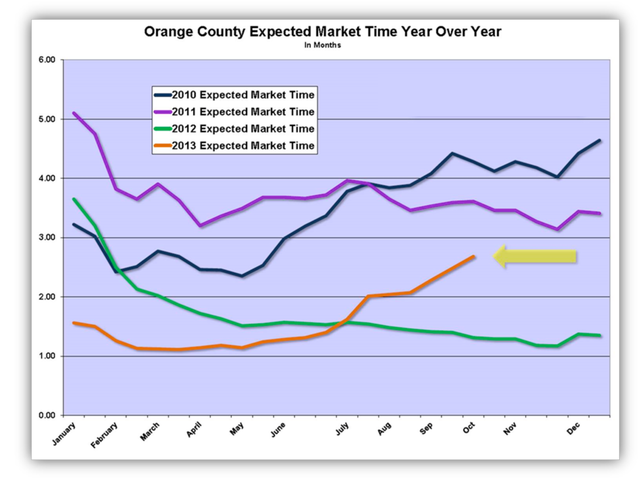
With the inventory rising and demand slowing, the expected market
time has been increasing.
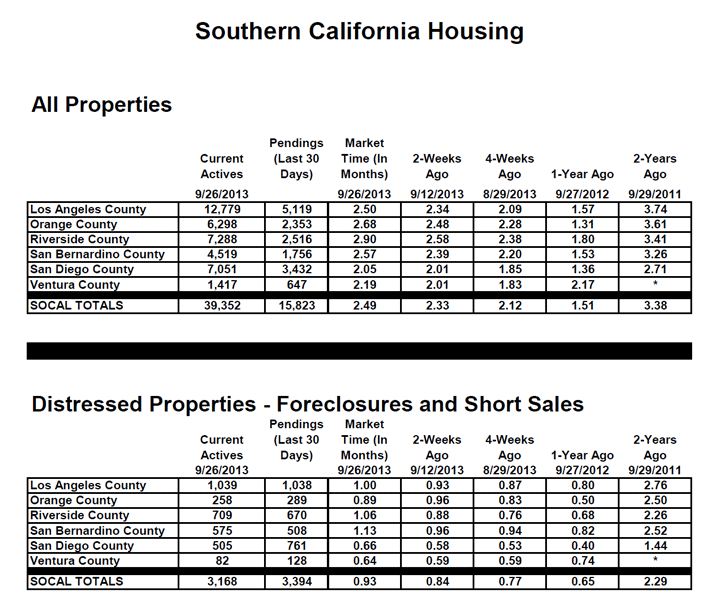
Expected Market Time: With an expected market time of 2.7 months, Orange County has not seen these levels since January 2012.
Orange County housing is moving away from a sizzling hot seller’s market with rapid appreciation to a cost conscious cooler market with restrained appreciation. The expected market time is how long it would take to exhaust the current supply of homes given current demand. Back in mid-March, the expected market time hit a new low, just 33 days, in records that date back to 2004. Today, it is at 2.7 months, or 80 days.
This about face is not unprecedented. Back in 2005, the expected market time hit a low of 34 days at the end of February and increased to 82 days by the start of October. From there, it continued to rise until it hit a high for the year of 4 months at the end of December. The inventory did not reach a peak until Thanksgiving and only started to drop when sellers finally decided to throw in the towel and fewer homeowners opted to place their homes on the market.
This year is very similar to 2005. The first half of the year was not whether or not a seller would be successful in selling, it was all about how many offers they could generate and how much more money they could get compared to the last closed or pending sale. $20,000, $30,000, $40,000 above the last comparable sale was normal. Buyers wrote offers on many homes to no avail. Sellers were in the driver seat and they knew it.
From July through today, the market has been adding a lot more homes and demand has been dropping. Since the end of June, the inventory has increased by 43% and demand has declined by 25%. This resulted in the expected market time nearly doubling in just a few months.
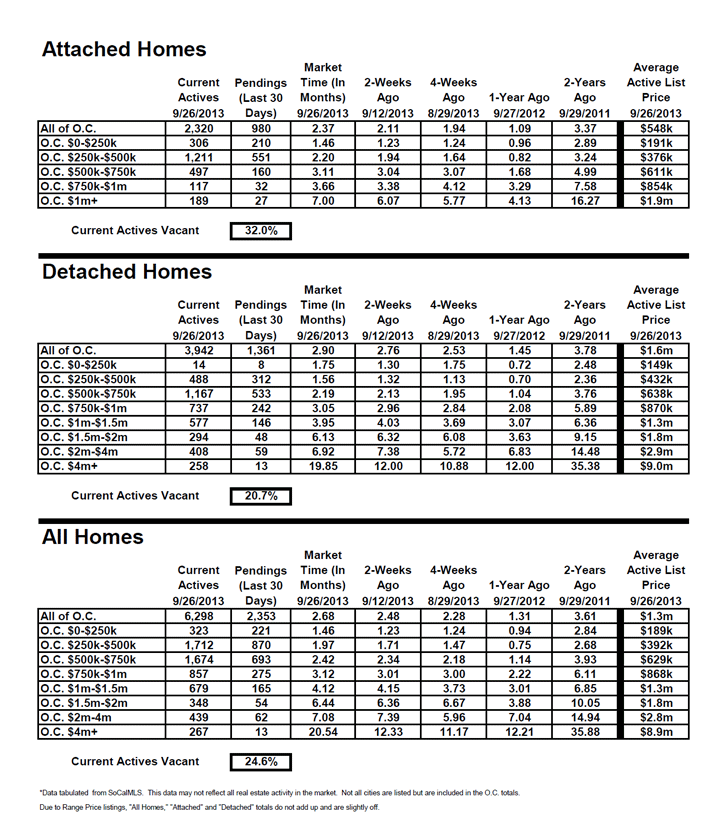
Let’s peel back the onion and see how the market has evolved this year. Despite voracious demand at the beginning of the year, the listing inventory began to rise in mid-March and has increased unabated ever since. It wasn’t just the high end. As a matter of fact, the $500,000 to $750,000 range has increased the most, 161% so far. The $250,000 to $500,000 increased by 130%. Any REALTOR® will confirm that the craziest price ranges in terms of multiple offers and rapid price increases had been taking place in these very same lower ranges.
The market was starting to cool as values began to dramatically recover from their recession lows a few years ago. What looked like a total deal and had attracted a wave of investors had lost a bit of its allure and luster. Investors started looking elsewhere. Homes began receiving fewer offers and buyers shied away from grossly overpriced homes.
The trend picked up momentum when interest rates rose at the end of June after the Federal Reserved announced that it would begin to taper their involvement in purchasing loans in the secondary market sometime in the near future. The mere mention of tapering set Wall Street reeling and interest rates shot up a full percentage point. Overnight, buyers were now looking at paying even more for homes that had already experienced a dramatic year over year increase in their values. At that point, buyers were not interested in paying much more than the last comparable or pending sale. It became all about price instead of acquiring a home at whatever cost.
Flash forward to today and buyers will simply ignore overpriced homes. Since sellers have continued to price their homes higher than the most recent comparable or pending sale, they have been languishing on the market. Buyers will not pursue these homes. Sellers are finding out the hard way that Orange County housing has changed. They are perturbed after being on the market for more than a week, even though expected market time is inching closer to three months. Slowly but surely, sellers are going to come to the realization that they have a decision to make: reduce the asking price or pull their home off the market.
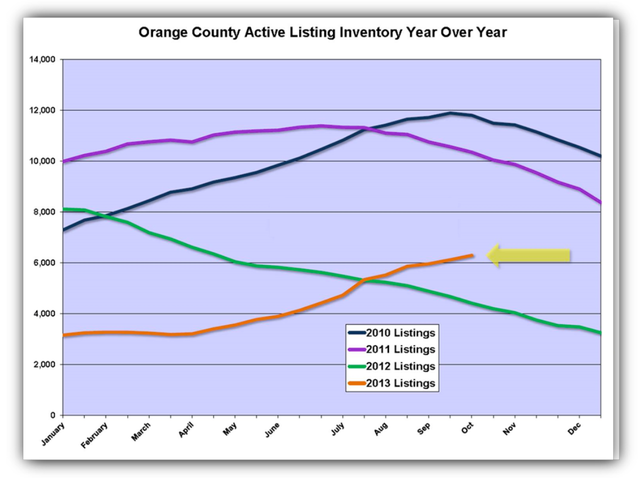
Active Inventory: The inventory increased by another 3% in the past two weeks.
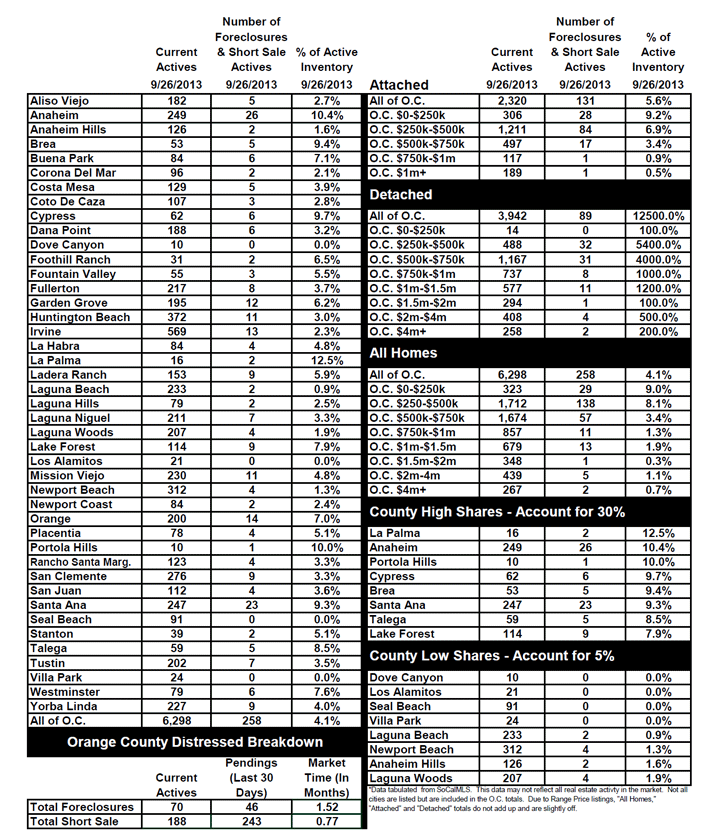
In the past two weeks, the active listing inventory added 175 homes, or 3%, and now totals 6,298, levels not seen since April 2012. In the past nine years, only once, in 2005, did the inventory not peak by this time of year. In that year, the inventory continued to climb until reaching a peak in mid-November. That was also the year that the market started shifting away from a seller’s market.
As more overpriced homes are placed on the market, the inventory will continue to rise. Combine that with decreased demand, and even more sellers will be unsuccessful. As we move deeper into the Autumn and Holiday Markets, properly pricing a home becomes paramount to finding success today.
Last year at this time there were 4,416 homes on the market, 1,882 fewer than today.
Demand: Demand dropped by 5% in the past two weeks.
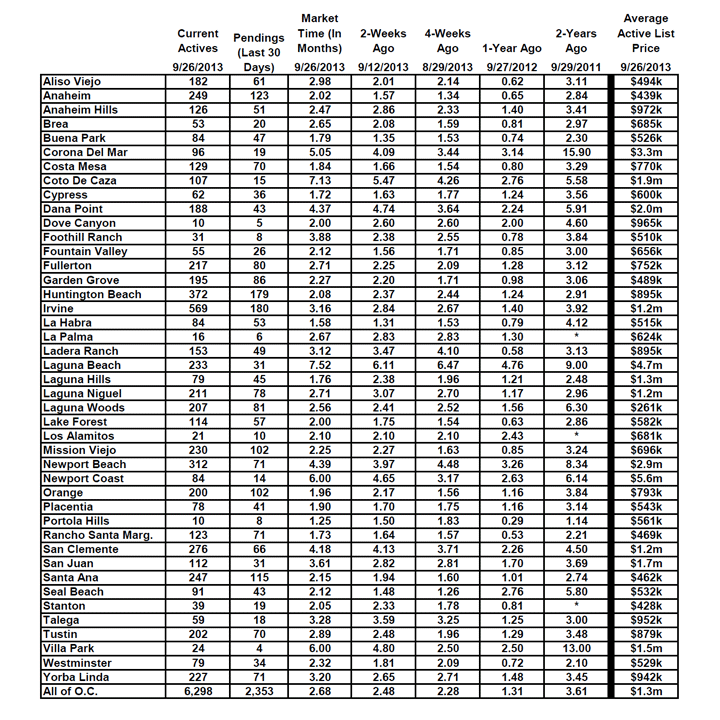
Demand continues to drop as we make our way through the Autumn Market. In the past two weeks, demand has dropped by 112 homes and totals 2,353. We have not seen these levels since January of this year. In the past six weeks, demand has declined by 17%.
This is cyclically a slower time of the year as demand downshifts a bit from the second best time of the year to sale, the summer. But, the downshift is a bit more pronounced this year. In the past nine years, the deceleration has averaged 11% from mid-August to the end of September, compared to 17% today. The change can be felt in the marketplace. On the weekends, major intersections once vacant are now populated by a sea of open house arrows. Buyer traffic has diminished. Multiple offers are growing less common. The Orange County housing market is evolving.
Last year demand was at 3,366 pending sales, 1,013 more than today. Those numbers need to be taken with a grain of salt. There were over 800 additional short sales embedded in those pending sales statistics and only about half of all short sales ever closed. But, the disparity of year over year pending sales is at its largest point of the year. This will translate to fewer sales in the waning months of 2013 compared to 2012.
Distressed Breakdown: The distressed inventory dropped by 3% in the past two weeks.
After posting the second largest gain of the year in the distressed inventory, foreclosures and short sales combined, two weeks ago, it dropped in the past two weeks by 3%, or 7 homes, and now totals 258. Only 4% of the active listing inventory and 12% of demand is distressed. Compare that to last year when it represented 14% of the inventory and 37% of demand. Thus, the current market is predominantly homeowners that have equity in their homes with only a hint of distressed.
In the past two weeks, the foreclosure inventory increased by 6 homes and now totals 70. Only 1% of the inventory is a foreclosure. The expected market time for foreclosures is 46 days. The short sale inventory decreased by 13 homes in the past two weeks, totaling 188, and remains the hottest segment of the Orange County housing market with an expected market time of only 23 days. Short sales represent just 3% of the total active inventory.
:format(webp):quality(80)/u.realgeeks.media/hakolas/Facebook.jpg)
:format(webp):quality(80)/u.realgeeks.media/hakolas/GooglePlus.jpg)
:format(webp):quality(80)/u.realgeeks.media/hakolas/YouTube.jpg)
:format(webp):quality(80)/u.realgeeks.media/hakolas/Twitter.jpg)
:format(webp):quality(80)/u.realgeeks.media/hakolas/Zillow.png)